


Monitoring software with chart and MS Excel output
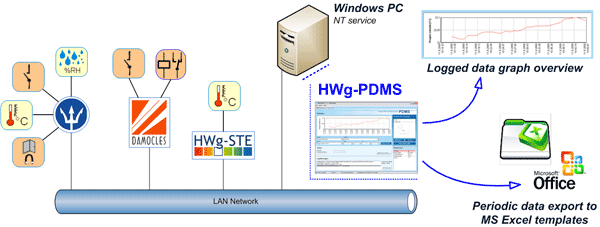
Windows application for collecting data from sensors and inputs over GSM (HWg-Ares) and LAN (Poseidon, Damocles, HWg-STE, HWg-PWR). Export of data in the background. Simple data processing and analysis in MS Excel.
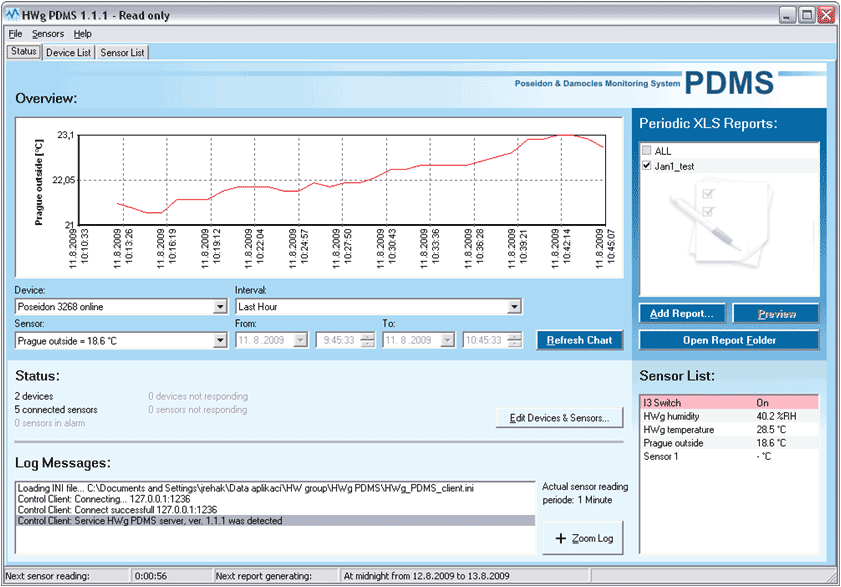
HWg-PDMS (Poseidon & Damocles Monitoring System) captures values of inputs and probes from devices connected over GSM or LAN. Data in the internal database can be periodically exported to MS Excel reports (protocols).
- Collects data from all IP sensors by HW group
- Periodic data export to MS Excel
- Sensor data can be collected by e-mail (e.g. from GSM/GPRS devices)
- HWg-PDMS is free of charge for 3 sensors (registration is recommended)
Application features
Application features
- Data input: LAN (http) / Email (POP3) / Portal (HWg-Push protocol)
- HWg-STE: Web thermometer (HWg-STE Push)
- Poseidon xxxx: Measure temperature, humidity, voltage, current, dry contact states etc. over LAN
- Damocles xxxx: Digital inputs and outputs over a LAN
- HWg-PWR: M-Bus IP energy metering
- HWg-WLD: Water leak detector
- HWg-Ares12: GSM IP sensor
- Data output:
- Graphic preview
- MS Excel export (.XLSx) + XML database (.XML) – daily / weekly / monthly
- Email report (daily / weekly / monthly)
- Operating system: MS Windows (x64) – including server versions
- Data input protocols: HTTP, SMTP, HWg-Push protocols
- Graphical output: Yes, can be saved to files
- Supported sensors: kWh, W, A, V, °C/°F, Cos Fi, Lx, %RH
- Pulse counter support: For Damocles units
- Data collection and export of reports runs periodically as a MS Windows service (NT service).
- License:
- HWg-PDMS Trial: Free of charge – 3 sensors
- HWg-PDMS 8: 8 sensors (data points)
- HWg-PDMS 20: 20 sensors (data points)
- HWg-PDMS Unlimited: Max 300 devices and 500 sensors (if you need more, contact us)
- Language versions: English / Czech / German / French / Dutch / Polish / Indonesian / Italian / Slovene
Typical HWg-PDMS usage scenarios
- IT department: HWg-PDMS software monitors energy consumption, temperature, supply of power, and access to cabinets with IT infrastructure.
- Overview of services for outsourcing: Keeping records of quality of the provided services. The generated MS Excel summaries can be attached to invoices for quality assurance purposes. Useful when a company delivers uncomfortable cold instead of air conditioning + maintenance.
- Audit: End user that needs data logging (operations / storage audit). For instance, storages of pharmaceuticals or food.
- Operations logs: History records that can be manually exported to MS Excel if needed.
Practical tips
Practical tips
- Remote monitoring – alerts
- XML data output
- Data input by Email (Pop3)
If you need to be alerted to sensor failures or readings out of range by email or text message, use the HWg-PD Trigger software.
Data are exported to MS Excel via a .xml file. This xml file can be generated in the background and used outside of MS Excel.
Data transfer by email works even for customers that use a NAT and cannot use a VPN. It is ideal for GSM sensors.
Exports to MS Excel
HWg-PDMS exports to MS Excel (report)
- One-time data export – Generated manually for the specified time period. Does not run in the background.
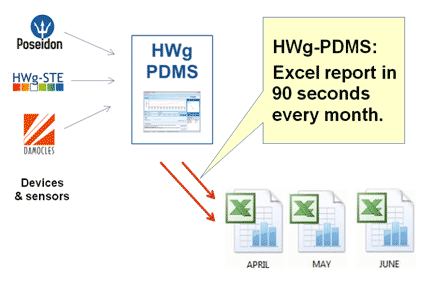
- Periodic data export – Generated automatically in the background after each period ends. For example, every Monday at 0:05 o'clock for the previous week.
Custom data visualization (report)
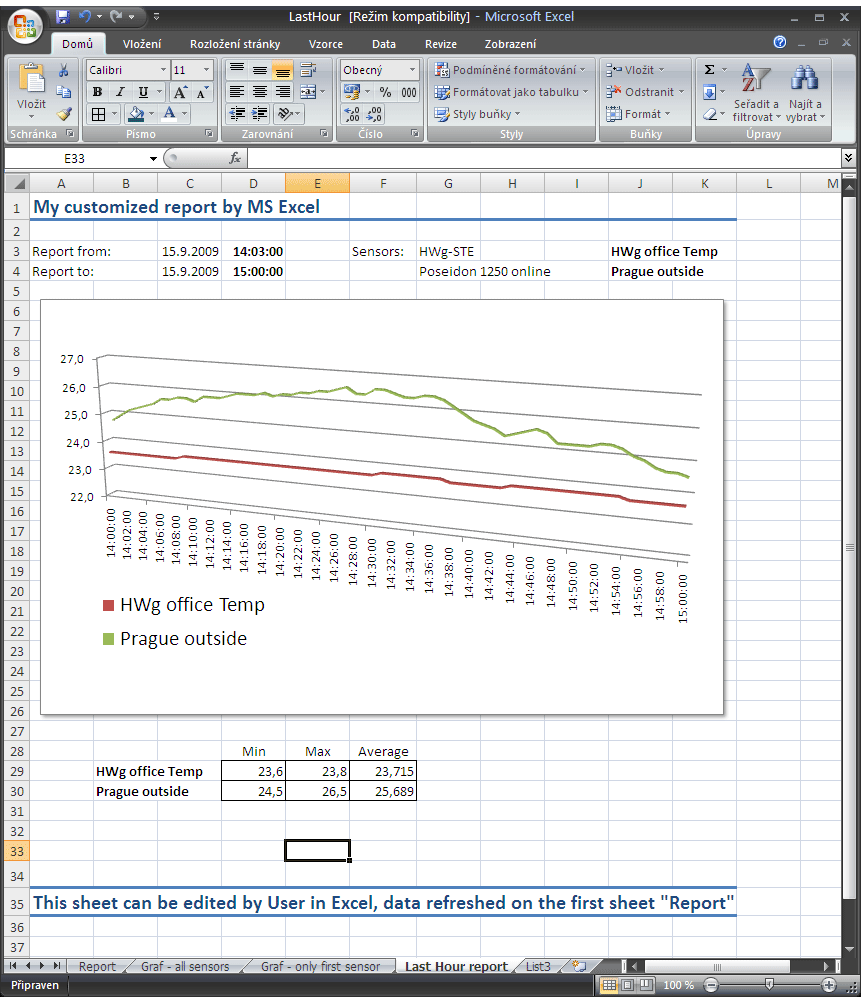
- MS Excel loads the data into the first sheet, named "Report".
- Data in the "Report" sheet
- If there are no data in the database for the given sensor at the given time, an empty cell is inserted.
- If the sensor is disconnected, "-999" is inserted.
- If the device was inaccessible, "-998" is inserted.
- Custom data presentations
- Use other sheets for your analysis of the data (ideally, ready for printing on a single page).
- When the template is next loaded, current data are inserted into the first sheet and MS Excel updates the charts and tables in other sheets.
- Even with lots of data, the report can be prepared and printed within 90 seconds.
- The number of lines in the "Report" sheet can vary according to the month (28 / 30 / 31 days), or if the PDMS application does not run. Take it into account in your formulas.
- Disable inserting -998 and -999 values, otherwise you need to take them into account in your formulas.
Other sheets can be used for storing custom visualizations for the data in the "Report" sheet.
Edit Report – description of the settings
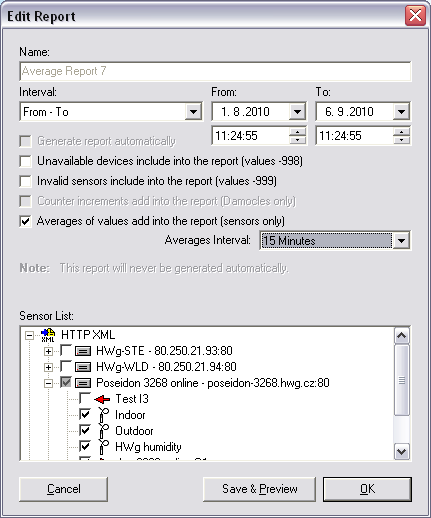
HWg-PDMS inserts the selected data into the first sheet, "Report", in the Excel file.
In order to read the data when the MS Excel file is opened, you need to enable MS Excel macros.
MS Excel report options
- Include value -998 (Unavailable device)
- When unchecked (default), values are ignored when the device was unreachable.
- Check to indicate unreachable devices ("-998" is inserted as the value).
- Include value -999 (Unavailable sensor)
- When unchecked (default), values are ignored when the sensor was unavailable.
- Check to indicate unavailable sensors ("-999" is inserted as the value).
- Include counter increments (Damocles only)
- Averages of Values
Creates a counter value for each Damocles DI input and inserts it to the Excel file.
Computes average values for the given time period and inserts them into the Excel file as a single value.
For example, use this to display an average over 15 minutes, even though the internal PDMS database includes a reading for every minute.
Enable the option, select 15 minutes, and the Excel report will only include 4 values per hour.